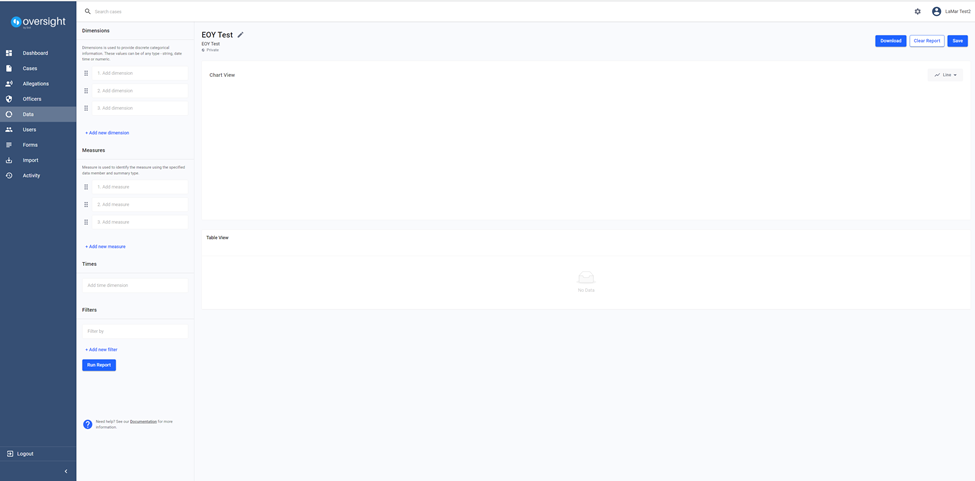
Creating new reports allows users to narrow down on the specific needs and requirements of the organization. Users can set reports to global or private.
Filter Options
Ability to filter cases
Sort
Ability to sort results
Rename Report

Custom Report Fields:
Dimensions
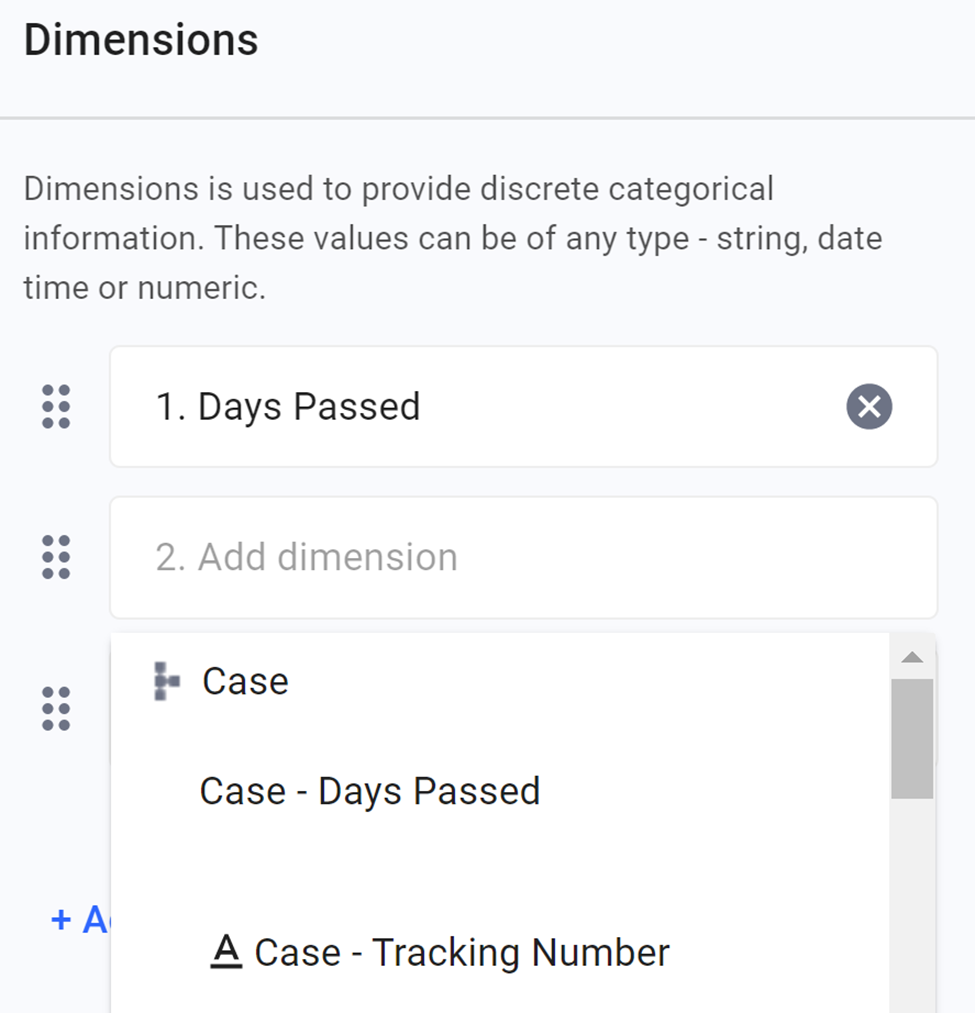
You can use dimensions to categorize, segment, and reveal the details in your data. Dimensions affect the level of detail in the view.
Measures
Measures contain numeric, quantitative values that you can measure. Measures can be aggregated.
Times
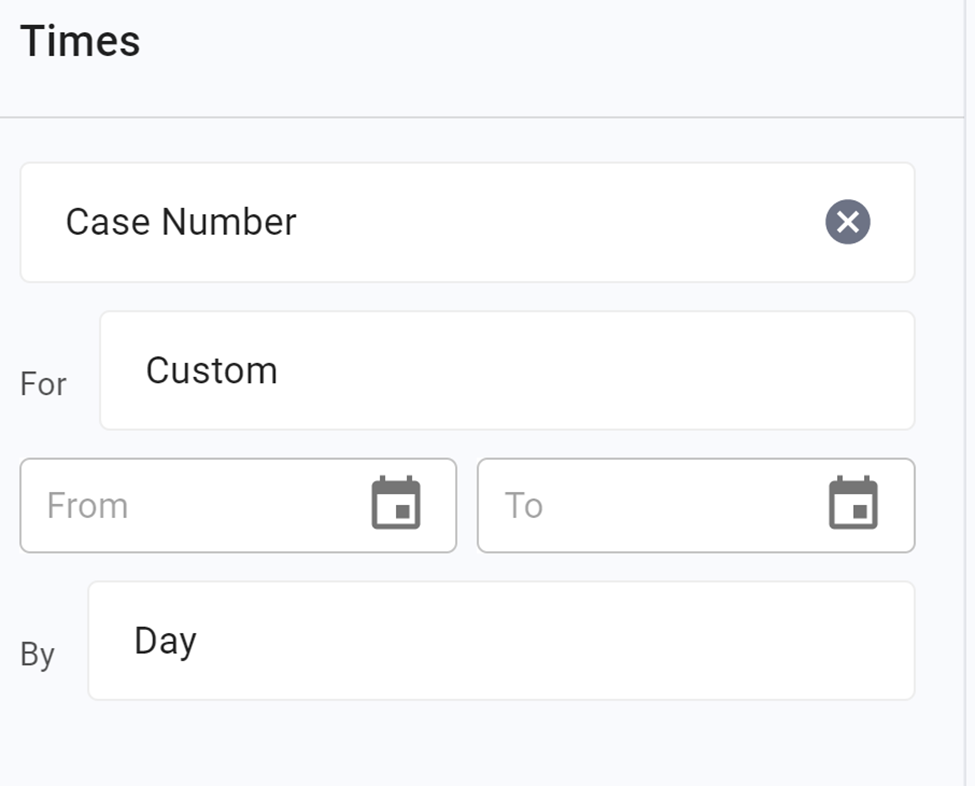
Use to set the date and time parameters
Filters
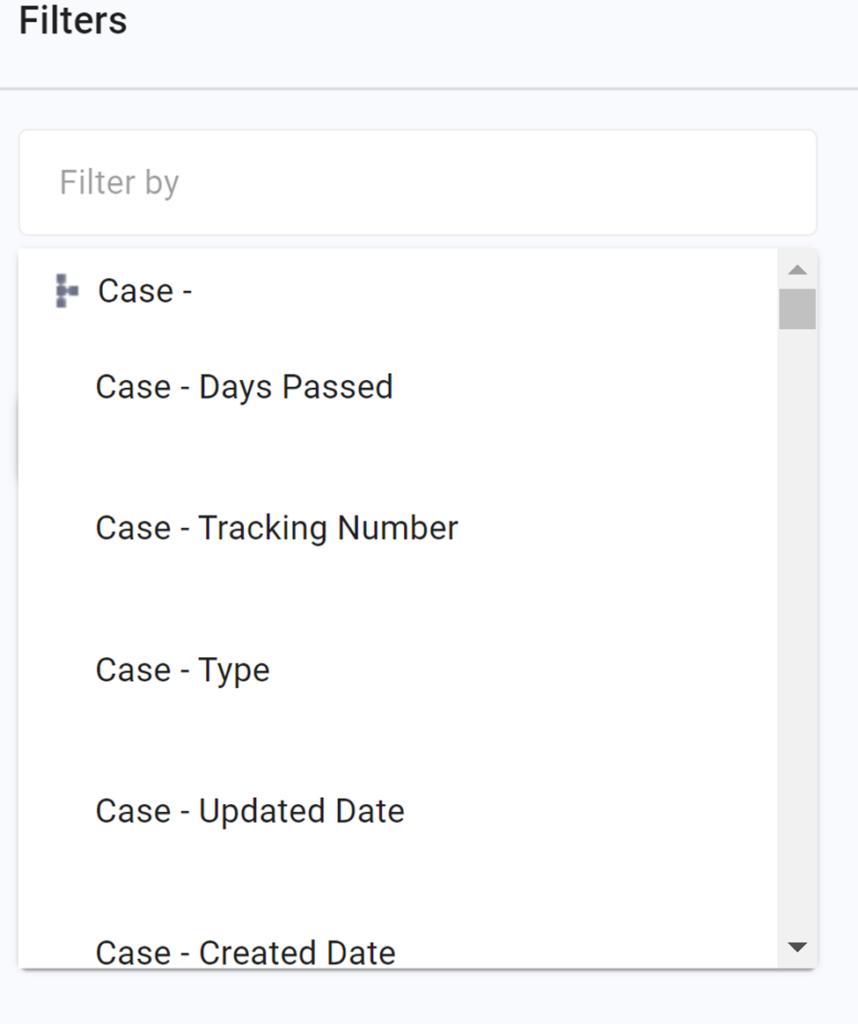
Use to set filter parameters
Creating Custom Reports (continued)
- Set the dimensions, measures, times, and filters as needed.
- Additional dimensions, measures, times, and filters can be added as needed
Fields are not dependent on each other
- Click Run Report to generate a graph and table view of the results
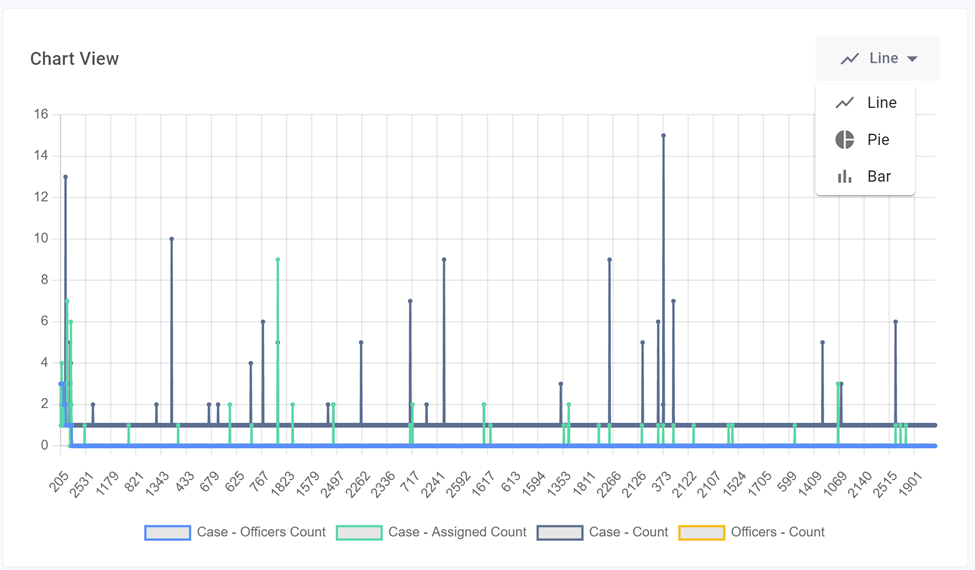
Graph View
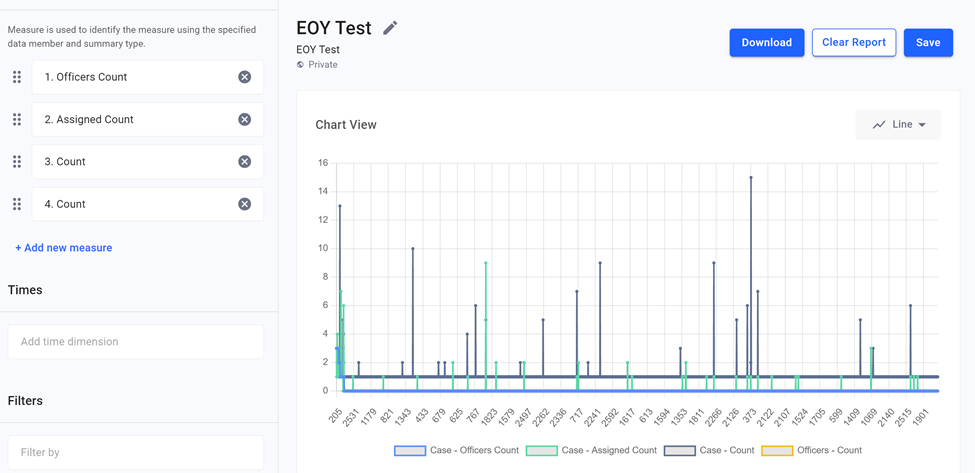
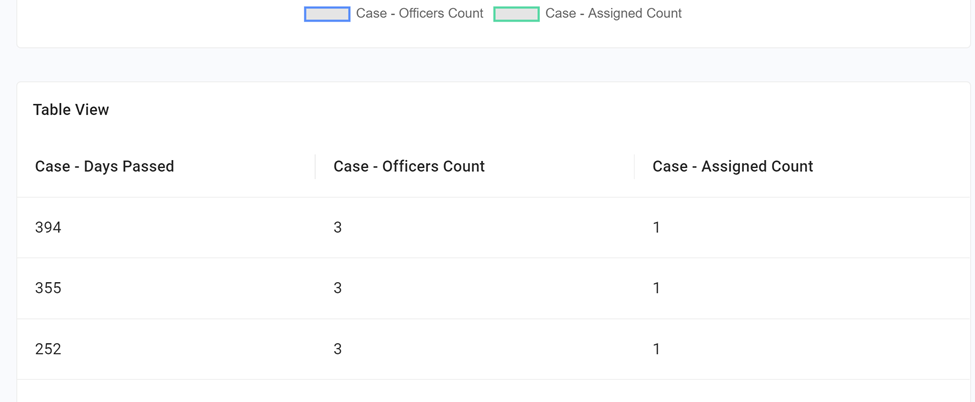
Table View
After the graph populates, users, can choose the graph display type (line, pie, or bar)
Users can download, clear, or save the results
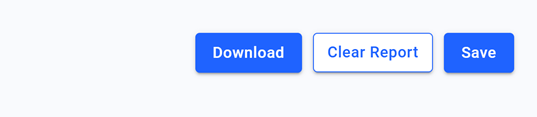
- Click Download to a PNG or CSV file
- Click Clear Report to start over
- Click Save to save the report